QCEChemistry

Dissociation Constants
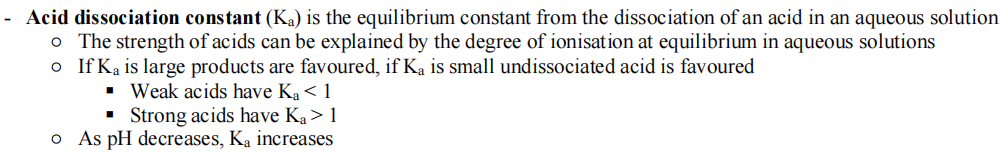
recognise that the strength of acids is explained by the degree of ionisation at equilibrium in aqueous solution, which can be represented with chemical equations and equilibrium constants (Ka)
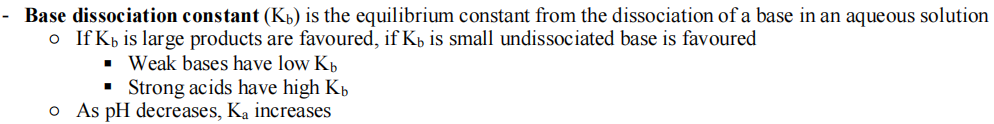
determine the expression for the dissociation constant for weak acids (Ka) and weak bases (Kb) from balanced chemical equations
analyse experimental data to determine and compare the relative strengths of acids and bases
use appropriate mathematical representation to solve problems, including calculating dissociation constants (K, and Kb) and the concentration of reactants and products.
Important: remember to include assumption - assume that -x is negligible for reactants
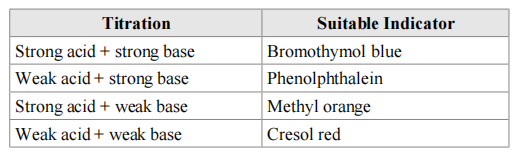
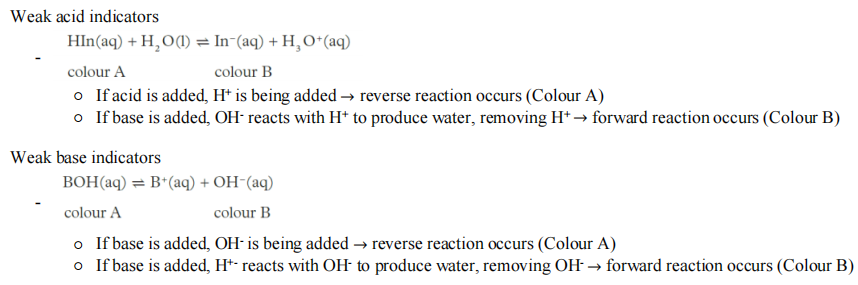
understand that an acid-base indicator is a weak acid or a weak base where the components of the conjugate acid-base pair have different colours; the acidic form is of a different colour to the basic form
- An indicator is a solution that changes colour dependent on the concentration of the hydrogen ions
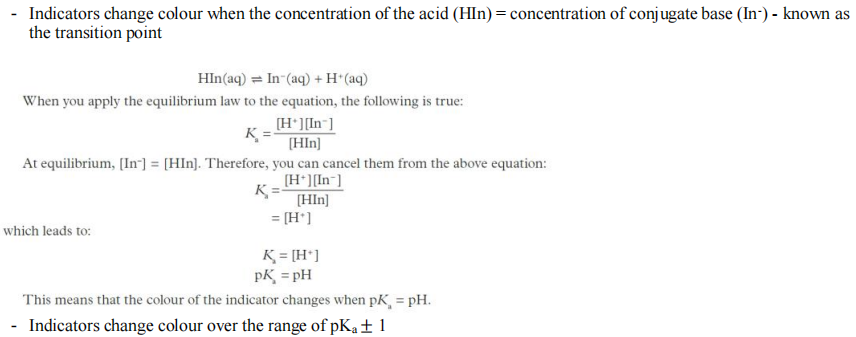
explain the relationship between the pH range of an acid-base indicator and its pk, value
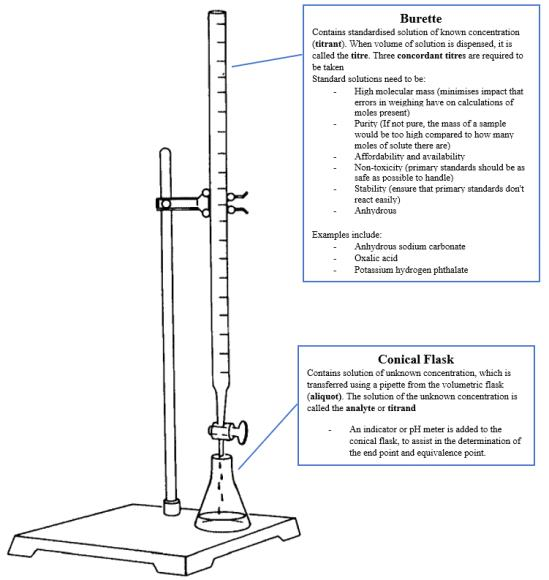
distinguish between the terms end point and equivalence point
- A titration is the addition of a solution of known concentration to a known volume of a solution of unknown concentration until the reaction reaches neutralization.
- The equivalence point is the point in a titration when the reactants have reacted in the molar ratio of the balanced chemical equation
No reactant is in excess. At equivalence point, there are no reactants remaining, only products (salt + water for acid-base titrations)
On a titration curve, it is represented where the gradient of the pH curve is the steepest
Half-equivalence point is the point in a titration curve where the concentration of the titre is equal to half the original concentration of the analyte and is called the midpoint.
- The end point is the point in a titration when the indicator changes colour
When [HIn] = [In-]
For a titration to be accurate, it is important to choose an indicator that changes colour closes to the equivalence point
recognise that acid-base titrations rely on the identification of an equivalence point by measuring the associated change in pH, using chemical indicators or pH meters, to reveal an observable end point
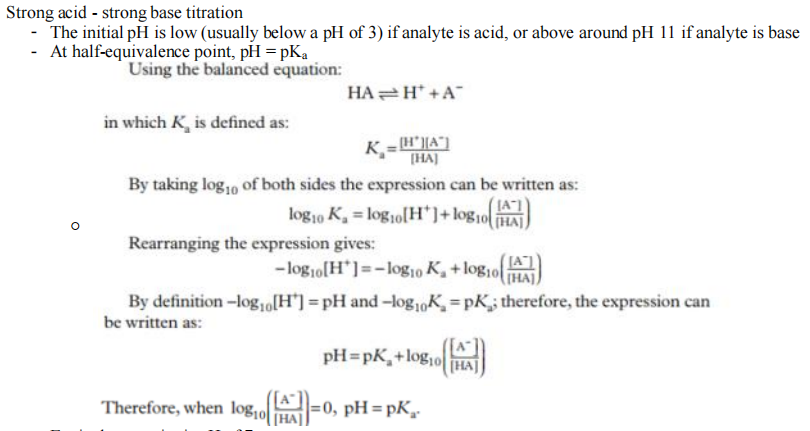
sketch the general shapes of graphs of pH against volume (titration curves) involving strong and weak acids and bases. Identify and explain their important features, including the intercept with pH axis, equivalence point, buffer region and points where pkg - pH or pK = POH
- Equivalence point is pH of 7
Neutral pH
Weak acid + strong base
- Weak acids have a pH range of approximately 3-7, so this is the pH axis intercept
- The buffer region is the section of a titration curve that is relatively flat because ad
Neutral pH
Do strong acid + strong base titrations have a buffer region, or is this only with weak substances?
They do, it is still the region where the pH does not change rapidly

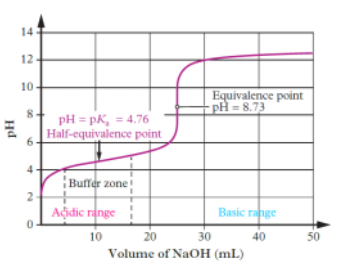
Weak acid + strong base
- Weak acids have a pH range of approximately 3-7, so this is the pH axis intercept
- The buffer region is the section of a titration curve that is relatively flat because adding more acid or base does not drastically affect the pH
Buffer region occurs before the equivalence point
- Half-equivalence point when pH = pKa or pOH = pKb
- Equivalence point is above pH of 7
nacid = nbase at equivalence point.
pH greater than 7
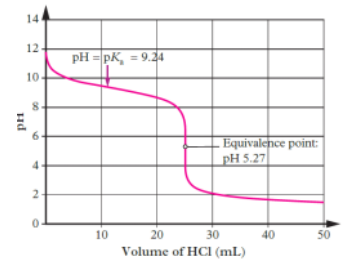
Strong acid + weak base
- Weak bases have a pH range of approximately 7-11, so this is the pH axis intercep
- Buffer region occurs before the equivalence point (typically around pH 8-10)
- Half-equivalence point when pH = pKa or pOH = pKb
- Equivalence point is below pH of 7
nacid = nbase at equivalence point.
pH less than 7
recognise that indicators change colour when the pH = pk, and identify an appropriate indicator for a titration, given equivalence point of the titration and pH range of the indicator.